Detection Rate
53.81%
Total Area
12.31 rai
Detected Trees
4,704
Expected
8,741
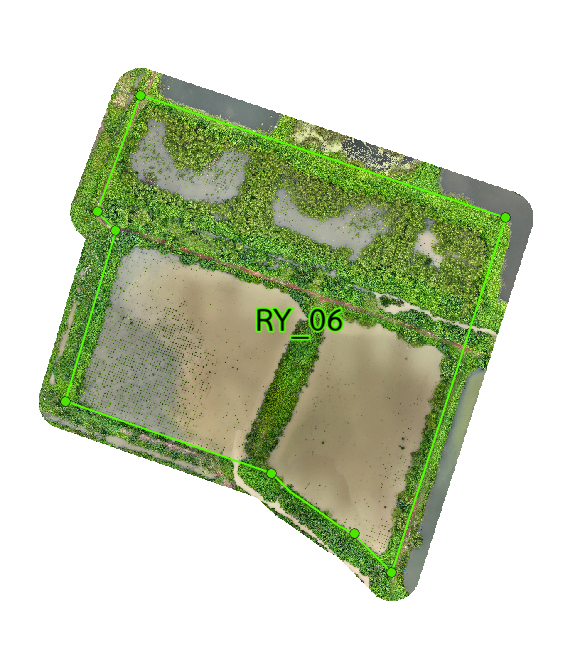
Plot 06 Overview
RY_06 covers 12.31 rai and has 5 subplots. It was planned for 8,741 trees, with 4,704 detected and a 53.81% detection rate. The plot is uneven overall, but RY_06-3 clearly stands out as the best area. RY_06 has a decent overall result, but the subplots are very different from each other. RY_06-3 performs best, while RY_06-4 is much weaker. This shows that small changes in site conditions have a big effect on survival. Growth is strongest in RY_06-3, where normal and high canopy levels are clustered well. The weaker subplots mostly stay at low growth because of water-related limits. If the site can improve drainage in those areas, overall growth should improve quickly.
Interactive Grid Detection Map
Grid Detection Analysis
This interactive map displays tree detections using advanced AI technology that analyzes multispectral satellite imagery to identify individual mangrove canopies. The surveyed area is divided into a grid system for precise monitoring of tree density and spatial distribution patterns.
Loading map...
Subplot Analysis
Tree Detection Summary
Technical Note
Detection is performed using multispectral drone imagery at 40m altitude. AI algorithms identify individual canopies within the range of 0.09 - 0.36 sqm.